What the boss actually wants on one screen
Ask the business owner which decisions the dashboard should help with. Choose a small set of useful numbers and agree on what each one means.
Need a word explained? Open the glossary →
Full lesson & technical details
Executives want five to eight numbers with a trend, a target and a reason. The interview that gets them, the KPI tree that structures them, and the one-page brief the client signs before any data is pulled.
Fifty charts is not a dashboard
A C-level dashboard answers one question: are we on track, and if not, where? That is five to eight metrics, each with the current value, the trend, the target and the variance. Everything else is drill-down. The person who hands a CEO fifty charts is handing over work; the person who hands over seven numbers is handing over a decision.
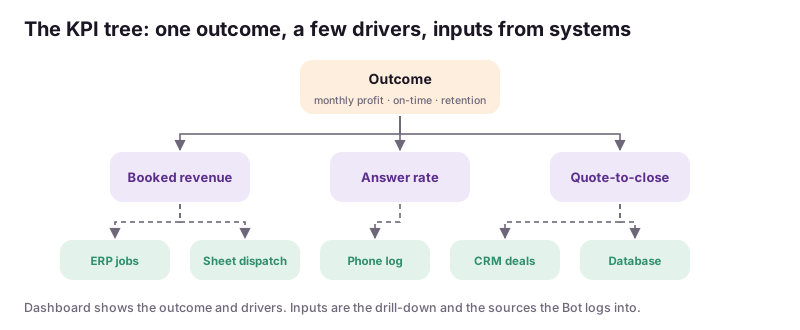
The KPI tree
Start at the outcome the executive is judged on (profit, cash, revenue growth, on-time delivery, retention). Underneath it, three to four drivers that move the outcome (new bookings, average order value, cost per job, churn). Under each driver, the inputs that live in a system (calls answered, quotes sent, hours billed). The dashboard shows the outcome and the drivers; the inputs are the drill-down and the source of the numbers.
The interview (30 minutes)
- “What three numbers do you check, or wish you could check, before your first meeting?”
- “When something goes wrong in the business, what is the first number that moved?”
- “Where does each of those live today, and who updates it?”
- “What would you do differently if you saw it daily instead of monthly?”
- “Who else should see this, and what should they not see?”
Question 5 decides access. Question 3 is the source list.
The brief (one page, signed)
For each metric: name, plain-English definition, formula, source system and field, owner, target, cadence (daily/weekly), and the red/amber/green thresholds. Plus: the audience list with permissions, the refresh time, the delivery (link, email, both), and what is explicitly out of scope. The client signs it by email. When “revenue” later turns out to mean three things, the brief is the referee.
Cadence and honesty
Daily refresh for operational metrics; weekly for financial ones that need month-end adjustments. Every dashboard shows its last-updated time and the source status. A number without a timestamp is a rumor.
Worked example
| Metric | Definition | Formula | Source | Target | RAG |
|---|---|---|---|---|---|
| Booked revenue (MTD) | Value of jobs scheduled this month, excluding cancelled | sum(job.value) where status in (scheduled, completed) and month = current | ERP: Jobs table | $410k | <90% red, 90–100 amber |
| Call answer rate | Share of inbound calls answered by a person or the AI receptionist within 30 s | answered / inbound | Phone system: call log export | 92% | <85% red |
| Quote-to-close (30d) | Quotes marked won ÷ quotes sent, trailing 30 days | won / sent | CRM: Deals | 38% | <30% red |
Instructions you can copy (prompts)
Copy the instructions, replace the words inside {braces} with your details, and paste them into your AI tool. Check and edit the answer.
Here are my notes from the 30-minute interview with {executive} at {company}: {notes}. Build a KPI tree: the outcome they are judged on, 3–4 drivers, and the inputs under each with the system each lives in. Then draft the one-page dashboard brief: for each of 5–8 metrics give name, plain-English definition, formula, source system and field, owner, target, cadence, and red/amber/green thresholds; then the audience and permissions, refresh time, delivery, and out-of-scope list. Mark anything I did not capture as ASK. Keep it to one page.
Interview a business owner you know (or use the sample client Bell Mechanical on the capstone page) and produce the KPI tree and brief. Paste the brief’s metric table.
Done when: Five to eight metrics with definitions, sources, targets and thresholds an executive would sign.. Sign up to save your work to your account.
Quick knowledge check
3 questions, 60% passes. Checkpoints, the certification exam (three versions) and the reviewed final project are unlocked with a free account.
- An executive dashboard shows:
- In a KPI tree, drivers are:
- The signed brief matters because: